API Reference
In all of these commands, p is a Project class instance. For more
details see Modules
section.
Initiate a project
$ from tsprocess import project as pr
$ p = pr.Project("Highf")
In this example, Highf is the project name, and p is the project instance. A database with the project name with “_db.sqlite” suffix will be generated. If a database with that name already exists, it will be used to retrieve records or add new records.
Close database
$ p.close_database()
Before closing the processing session, make sure to close the database connection. Closing database makes sure to store any data in the buffer in the database.
Add incidents
Registers incident folder with the current project. Loads projects description.txt and detects the project type. However, does not load any data. For more details about incidents, please see Incidents section.
$ p.add_incident(path_to_incident_folder)
Remove incidents
Removes registered incident from the project. The original data is not modified, however, all records that are related to the incident and are strored in in-memory cache or on the database will be removed.
$ p.remove_incident(incident_name)
List of available incidents
Each incident has a unique name, which is provided in the description.txt file (see here ). You can see a list of available incidents by using the following command:
$ p.list_of_incidents()
Compare incidents
Compares different keys in the incidents’ metadata and return them in a tablulated format.
$ p.compare_incidents(['compare_incidents(['hercules101','hercules102'],\
  only_differences=False)'])
Add filter for selecting stations
Processing the results are based on selected stations. Users can define different filters for selecting stations, the filters can be used together. In that case those stations that satisfy all filters will be returned. This should not to be confused with timeseries filtering.
The following table shows different station filter type and their required arguments.
Filter Type |
Required Arguments |
|---|---|
epi_dist_lt |
“distance”: float, distance in km |
epi_dst_lte |
“distance”: float, distance in km |
epi_dist_gt |
“distance”: float, distance in km |
epi_dist_gte |
“distance”: float, distance in km |
azimuth_bt |
“azmth”: [float, float], in [0, 360] |
include_stlist_by_incident |
“incident_name”, “stations” |
exclude_stlist_by_incident |
“incident_name”, “stations” |
$ p.add_station_filter(station_filter_name, filter_type , {arguments})
The station filter name is optional, however, it should be a unique name.
Based on epicentral distance
These filters only takes epicentral distance as argument. Here is an example of adding station filter to include all stations with epicentral distance less than 10 km.
$ p.add_station_filter("lesst10", "epi_dist_lt", {"distance":10})
Based on azimuth
Selects stations from the start azimuth to the end azimuth. Assuming az2 > az1:
[az1, az2]: includes all stations with az1 < az < az2
[az2, az1]: includes all stations with az2 < az < 360 and 0 < az < az1
Based on station name
Selects stations based on their name. Since one station has different name in different incidents, one should select an incident as a reference.
$ p.add_station_filter("select_stations", "include_stlist_by_incident",\
 {"incident_name":"hercules101", "stations":['station.5','station.206']})
Defines a filter to select those stations that in hercules101 incident they named as station.5 and station.206. Please note that this filter inlcudes stations regardless of their incident. Incident and station name are just used to detect the station location based on known parameters.
Add processing label
In tsprocess we assign a unique Id for each seismic record. Any processing action is also has a unique Id. Through these unique ids (hash values) we can track any record that has been gone throught different processes. Users are not allowed to directly process any records, however, they can define processing labels and apply those labels on the records. The following command shows how to add a new processing labels. There is no limitation on the number a processing labels and it can be defined at any place before it is called.
The following table shows different label types and their required arguments.
Label Type |
Required Arguments |
|---|---|
lowpass_filter |
“N”:order, “fc”: corner frequency |
highpass_filter |
“N”:order, “fc”: corner frequency |
bandpass_filter |
“N”:order, “fcs”: [fc1, fc2] corner frequencies. |
rotate |
“angle”: rotation angle in degrees |
scale |
“factor”: scaling factor |
taper |
“m”: number of points, “flag”: “front”,”end”,”all” |
cut |
“m”: number of points, “flag”: “front”,”end”, “t_diff”:cut time (s) |
zero_pad |
“m”: number of points, “flag”: “front”,”end”, “t_diff”:added time (s) |
set_unit |
“unit”: requested unit “m”(meter) or “cm”(centimeter) |
set_vertical_or |
“ver_or”: vertical orientation “up” or “down” |
align_record |
“hc_or1”, “hc_or2”, “ver_or”: horizontal components and vertical component orientation. |
filters
Timeseries filters are created based on forward-backward digital filter using cascaded second-order sections. In this package we only use Nth order Butterworth digital filters. All filters require filter order as an input argument, the default value is 4.
Here is an example of adding lowpass filter with corner frequency at 2 Hz.
$ p1.add_processing_label('lpf2','lowpass_filter',{"N":4, "fc":2.0})
rotation
Rotating timeseries are done at the record level. In case of simulation incidents, the orientation of the records are provided by the user in the description.txt file. In case of observation (e.g., CESMD format), each record comes with different orientation. The command is applying a relative rotation. Records orientation will be adjusted.
Processing records
There are numerous packages for processing seismic timeseries. tsprocess is a platform to manage large number of stations and incidents. Therefore, one can plot a timeseries, however, with the processing labels and stations filters he/she can define which incidents, which stations, and what processing should be applied on them before plotting the timeseries. Users never manually store any processed data. The function prototype is according to the following:
command(list of incidents,
         nested list of processing labels for each incident,
         list of station filters,
         dictionary of optional parameters)
Depending on the command and optional parameters, The output will be in a different format; however, in almost all commands in this format, a list of records will be extracted from the database or will be generated.
We track incidents based on their incident_name attribute, which is defined by the author of the incident folder inside the description.txt file.
Each incident goes through different processing steps. For each incident, we have a list of processing labels. If it passed as an empty list, it would return the original data. Processing steps will be applied by their order in the list. The first label will be applied first.
The intersection of different station filters will determine which station should be included in the final results.
Optional parameters are a dictionary container that provides control over the final results.
Optional parameters
Fine tuning the final results and storing the final results on the disk (as a product) can be controlled by optional parameters. In the following a list of optional parameters and their functionality are presented. Optional parameters that are not suppported with the commands will be ignored.
zoom_in_freq
parameter: a list of min and max frequency (Hz) [float, float]
In plots: it will apply limit on frequency axis representation.
Data is not modified.
zoom_in_time
parameter: a list of min and max time (s) [float, float]
In plots: it will apply limit on time axis representation.
Data is not modified.
zoom_in_rsp
parameter: a list of min and max period (s) [float, float]
In plots: it will apply limit on period axis representation.
Data is not modified.
save_figure
parameter: True or False, default value is False.
Plot displacement timeseries
Plots displacement timeseries with their Fourier transfer amplitude (fft) for all three components. One figure per station.
- Optional parameters:
zoom_in_time
zoom_in_freq
save_figure
The following example plots all orignal records provided by hercules101 incident.
$ p.plot_displacement_records(['hercules101'],[[]],[],{})
Plot velocity timeseries
Plots velocity timeseries with their Fourier transfer amplitude (fft) for all three components. One figure per station.
- Optional parameters:
zoom_in_time
zoom_in_freq
save_figure
The following example plots all orignal records provided by hercules101 incident.
$ p.plot_velocity_records(['hercules101'],[[]],[],{})
Plot acceleration timeseries
Plots acceleration timeseries with their response spectra (rsp) for all three components. One figure per station.
- Optional parameters:
zoom_in_time
zoom_in_rsp
save_figure
The following example plots all orignal records provided by hercules101 incident.
$ p.plot_acceleration_records(['hercules101'],[[]],[],{})
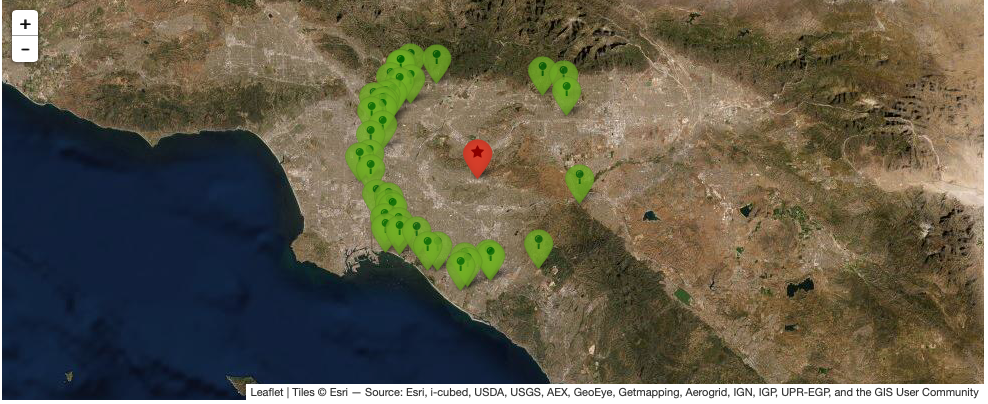
Show stations on the map
Using leaflet API, users can take a look at stations on the map. It follows the same function signature. The following command shows the stations in distance between 25 and 30 Km from 2014 5.1 La Habra, CA, earthquake. Stations’ popups shows station names.
$ p1.show_stations_on_map(['hercules101'],[[]],['lesst30','moret25'])
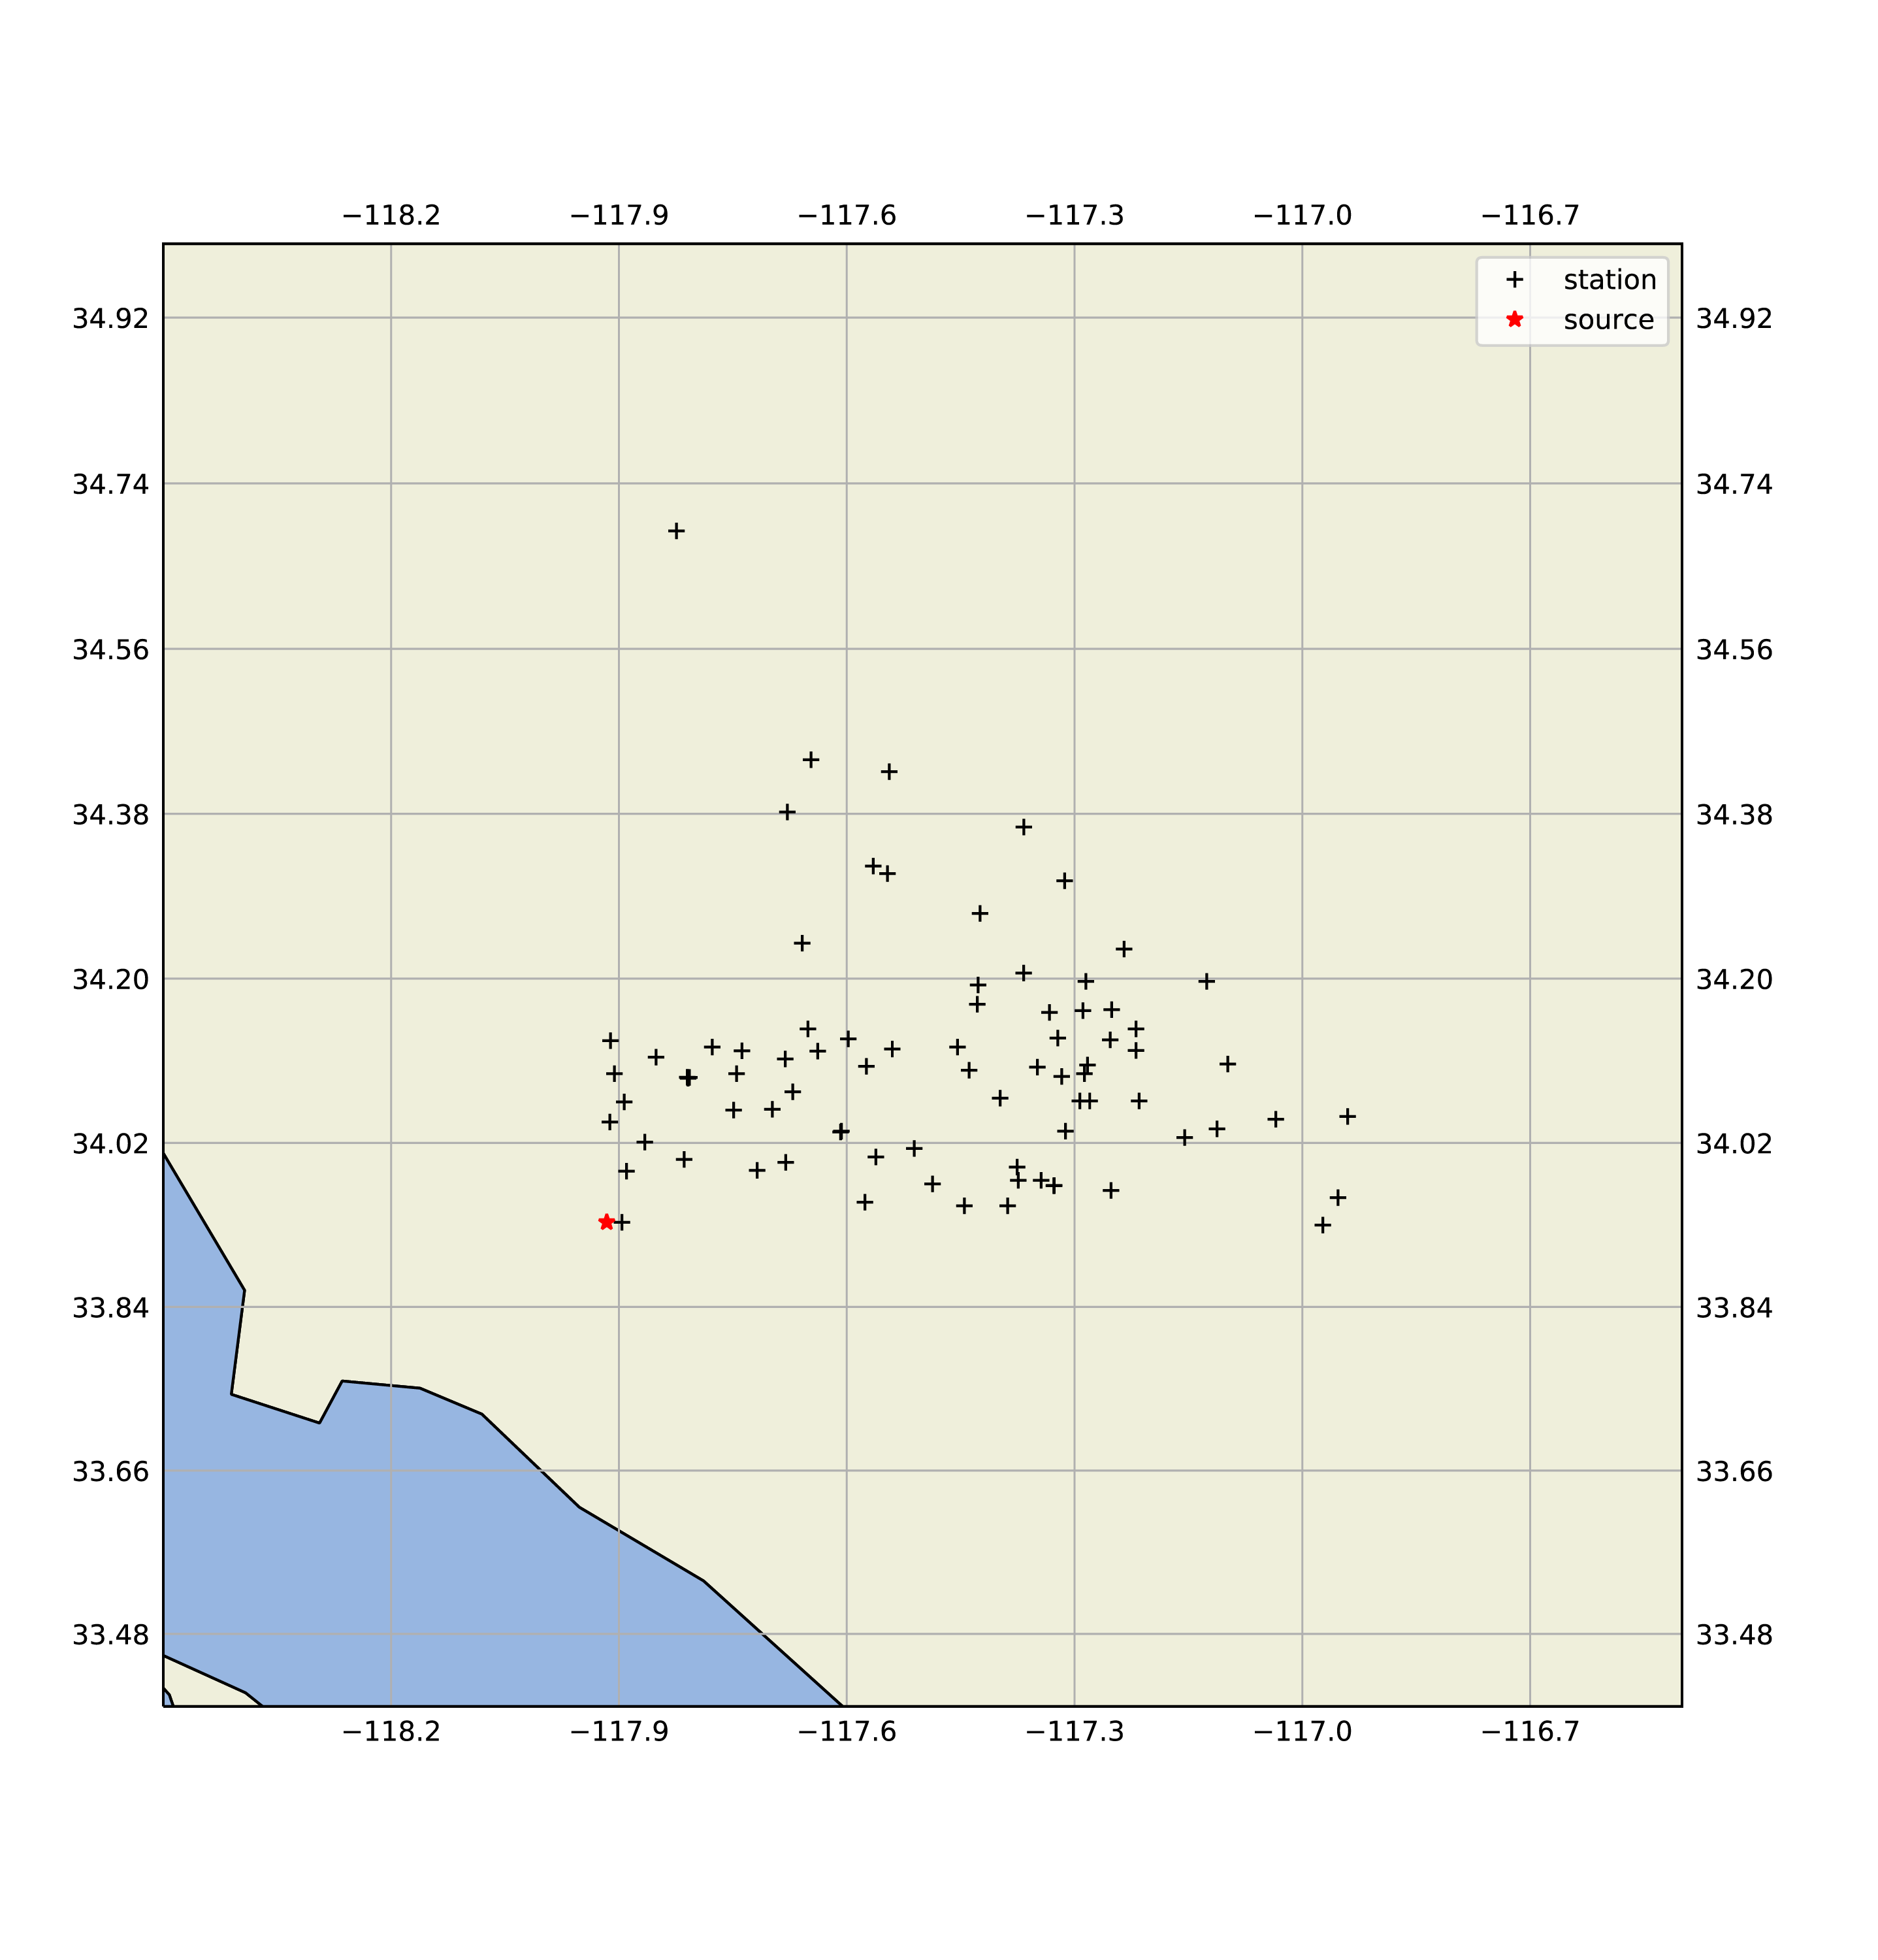
Show stations on the map (cartopy)
Shows stations and source on the map using cartopy package. The following command shows the stations in azimuth between 0 and 90 degrees from 2014 5.1 La Habra, CA, earthquake.
$ p1.add_station_filter("az090","azimuth_bt",{"azmth":[0,90]})
$ p1.show_stations_on_map2(['hercules101'],[[]],['az090'])